Optimizing Nitra-Nox Odor Control Feed Rate Based On Hydrogen Sulfide Gas Testing

Ready to learn more? Reach us to get started.

Overview

Overview

Aulick technical consultants worked with two utilities and a prison in Kentucky to eliminate hydrogen sulfide odor and corrosion issues at a Pump Station and to optimize Nitra-Nox – Odor Control for Hydrogen Sulfide Prevention – feed rates.

Location
Kentucky
Market
  • Odor Control

Introduction

Introduction

Hydrogen Sulfide is a colorless, toxic, highly flammable gas with a foul, pungent odor similar to that of rotten eggs. Often referred to as “sewer gas”, hydrogen sulfide is a result of the breakdown of organic matter by bacteria, typically in an oxygen deprived environment such as a collection system or wastewater treatment plant.

Controlling this hazardous gas is one of the most challenging problems facing collection system personnel today. Not only is it a nuisance, hydrogen sulfide has the potential, even at low concentration levels, to pose extreme safety hazards for plant personnel, while its corrosive nature is detrimental to city infrastructure, wastewater treatment plant and collection system equipment.

Challenge

Challenge

In this specific application, Pump Station B received wastewater flow from a medium security prison in the collection system.

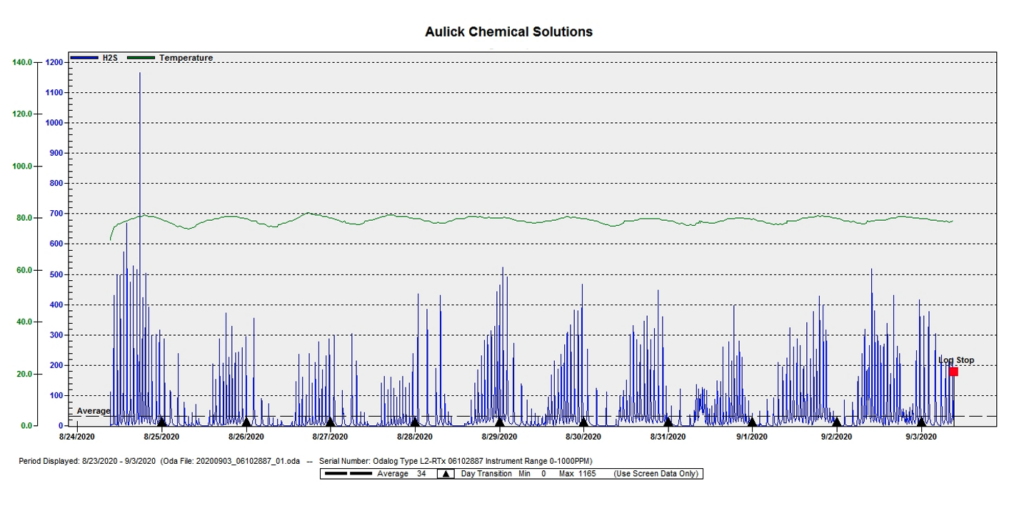
Graph 1: the above graph illustrates varying feed rates of Nitra-Nox and also the elimination of Nitra-Nox feed at the prison to isolate the main contributor of hydrogen sulfide at the test site. Feed rates were 10 GPD at City 1 and 20 GPD at the prison – prison feed was turned off during this testing period.

  • Graph 1 Data:
    • Avg. H2S PPM: 34
    • Max H2S PPM: 1165
    • Nitra-Nox feed rate GPD: 10 @ City 1 and 20 @ Prison


This was a combined problem at the prison and City 1.  It was Aulick’s assumption from day 1 that the major contributor to the hydrogen sulfide issue was coming from the prison. Aulick did not consider that City 1’s flow consisted mainly of restaurants and recreational housing. Aulick therefore established a need to recalculate feed rates for both sites. Technical consultants gathered force main length, diameter, retention time, and BOD concentrations for the City 1 collection system.

Graph 2 will illustrate recalculated Nitra-Nox feed rates for both sites.

Our Solution

Our Solution

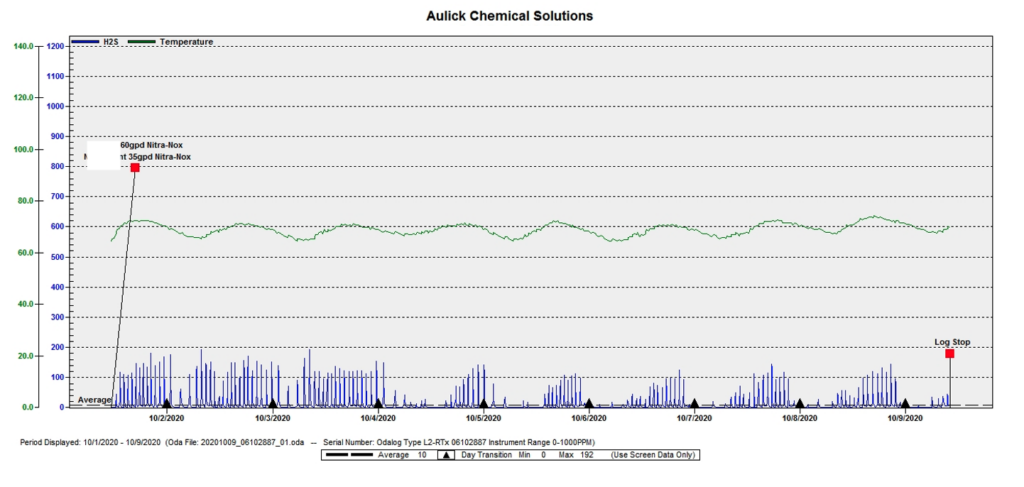
Graph 2: after receiving data on this line, both Nitra-Nox feed rates were re-calculated to 35 GPD at the prison and 60 GPD at City 1. With both contributors feeding calculated dosages of Nitra-Nox, a significant reduction of hydrogen sulfide occurred.

  • Graph 2 Data:
    • Avg. H2S PPM: 10
    • Max H2S PPM: 192
    • Nitra-Nox feed rate GPD: 60 @ City 1 and 35 @ Prison

Our Results

Our Results

Conclusion: During the course of this project, Aulick had to analyze hydrogen sulfide data from two utilities; City 1 and City 2. In the beginning, the Nitra-Nox feed at the prison did very little in terms of reducing hydrogen sulfide. At this point it could have been determined that the Nitra-Nox simply was not working for this application. However, Aulick went back to ground zero and addressed each utility independently. Once feed rates at each site were adjusted accordingly, the average hydrogen sulfide level reduced by 70% and the hydrogen sulfide peak concentration was reduced by 84%.

Aulick’s goal was to reduce hydrogen sulfide odor/corrosion, ensure efficiency of budgetary expenses, and maintain an average of 10ppm or less of hydrogen sulfide. Up to this point, corrosion is minimal which will allow for longevity of collection system infrastructure and will eliminate residential odor complaints.

The feed rates presented in this case study were recommendations. It was an added benefit that this trial was conducted during the hottest and driest time of the year. These are max feed rates –  during fall, winter, and spring, Aulick proposes to monitor and reduce the Nitra-Nox feed rate to an acceptable level. City 1, City 2, and the prison will have to decide what the acceptable feed rates will be.